
TL;DR:
- Choosing the right environmental monitoring system is critical for compliance, efficiency, and scalability.
- AI-enhanced sensor networks enable significant energy savings and proactive operational decisions.
- Integrating monitoring data effectively and ensuring sensor reliability drive long-term infrastructure performance.
Balancing regulatory compliance, operational efficiency, and long-term scalability is one of the most demanding challenges facing operations managers in critical infrastructure today. Choosing the wrong environmental monitoring system does not just create compliance risk — it locks your organization into operational blind spots that erode energy efficiency and inflate resource costs year after year. The environmental monitoring market is projected to grow from $19.89 billion in 2020 to $43.48 billion by 2030, reflecting how seriously the industry is taking this challenge. This article maps the key monitoring types, compares their strengths, and helps you select the right solution for your specific operational context.
Table of Contents
- Criteria for evaluating environmental monitoring types
- Direct measurement: Continuous emissions and predictive monitoring
- Integrated sensor networks for air, water, and deposition monitoring
- AI-enabled environmental monitoring for energy savings
- Why most environmental monitoring investments fall short
- Connect with scalable monitoring solutions
- Frequently asked questions
Key Takeaways
| Point | Details |
|---|---|
| Assess needs first | Define compliance, cost, and operational goals before selecting any monitoring system. |
| Balance direct and predictive | Use CEMS for regulatory certainty and PEMS for scalable, flexible monitoring. |
| Leverage sensor networks | Deploy integrated air and water sensors for comprehensive, actionable insight. |
| Adopt AI-enabled platforms | AI tools maximize energy savings and streamline reporting for real-time optimization. |
| Prioritize integration | Technology delivers value only when fully integrated with operations and maintenance. |
Criteria for evaluating environmental monitoring types
Before committing to any monitoring technology, your team needs a clear framework for evaluation. A system that works well in a water utility may be entirely unsuited for a distributed energy operation or a large-scale agricultural site. Understanding what separates a reliable, scalable solution from an expensive disappointment is the starting point.
Regulatory compliance and certainty sit at the top of every evaluation. Some monitoring types are legally mandated in specific sectors. Continuous Emissions Monitoring Systems (CEMS) are often required by environmental agencies for large combustion facilities. If your operation falls under such mandates, the monitoring type is partly chosen for you. However, for organizations with more flexibility, evaluating which approach meets current and anticipated regulatory standards is critical.
Cost versus operational savings is never a simple calculation. Hardware-based systems carry higher upfront capital costs, while software-driven predictive models tend to lower deployment costs but require robust process data inputs to function accurately. The real financial picture includes installation, calibration, ongoing maintenance, data management infrastructure, and staff training. A technology guide for facility managers can help quantify these costs across different deployment models.
Scalability for energy and resource operations determines whether your system grows with you. A single-site solution that cannot integrate additional nodes, sensors, or connectivity protocols will force a costly overhaul as your infrastructure expands. Prioritize platforms that support LoRa, NB-IoT, LTE-M, Wi-Fi, and Ethernet from the outset.
Here are the core evaluation criteria your team should assess before any procurement decision:
- Regulatory alignment: Does the system meet current legal standards and anticipate future mandates?
- Total cost of ownership: Capital, maintenance, calibration, and data processing costs over a 5 to 10 year horizon
- Hardware and software reliability: Sensor durability, uptime guarantees, firmware update protocols
- Edge versus cloud processing: Real-time edge decisions for low-latency needs versus cloud analytics for long-term trend analysis
- Integration capability: Compatibility with existing SCADA, ERP, or building management systems
- Data resolution: Frequency of data capture and whether it supports operational decisions at the granularity you need
The global environmental monitoring market at $43.48B by 2030, with North America holding the largest share, signals that investment in this space is accelerating. Organizations that build their evaluation frameworks now will be positioned to adopt emerging technologies without disruption.
Direct measurement: Continuous emissions and predictive monitoring
When it comes to tracking emissions from power generation, industrial combustion, or manufacturing processes, two primary methodologies define the field. Each has a distinct operational profile, cost structure, and regulatory standing.
CEMS (Continuous Emissions Monitoring Systems) use physical hardware installed directly in exhaust stacks or flue gas streams. Sensors and analyzers sample gas concentrations in real time, capturing pollutants such as sulfur dioxide, nitrogen oxides, carbon monoxide, and particulate matter. CEMS data is transmitted continuously and is legally accepted by most environmental regulatory bodies. This direct measurement approach offers high accuracy and regulatory certainty, but it comes with real operational demands: hardware maintenance, regular calibration, component replacement, and skilled technicians to manage the systems on-site.
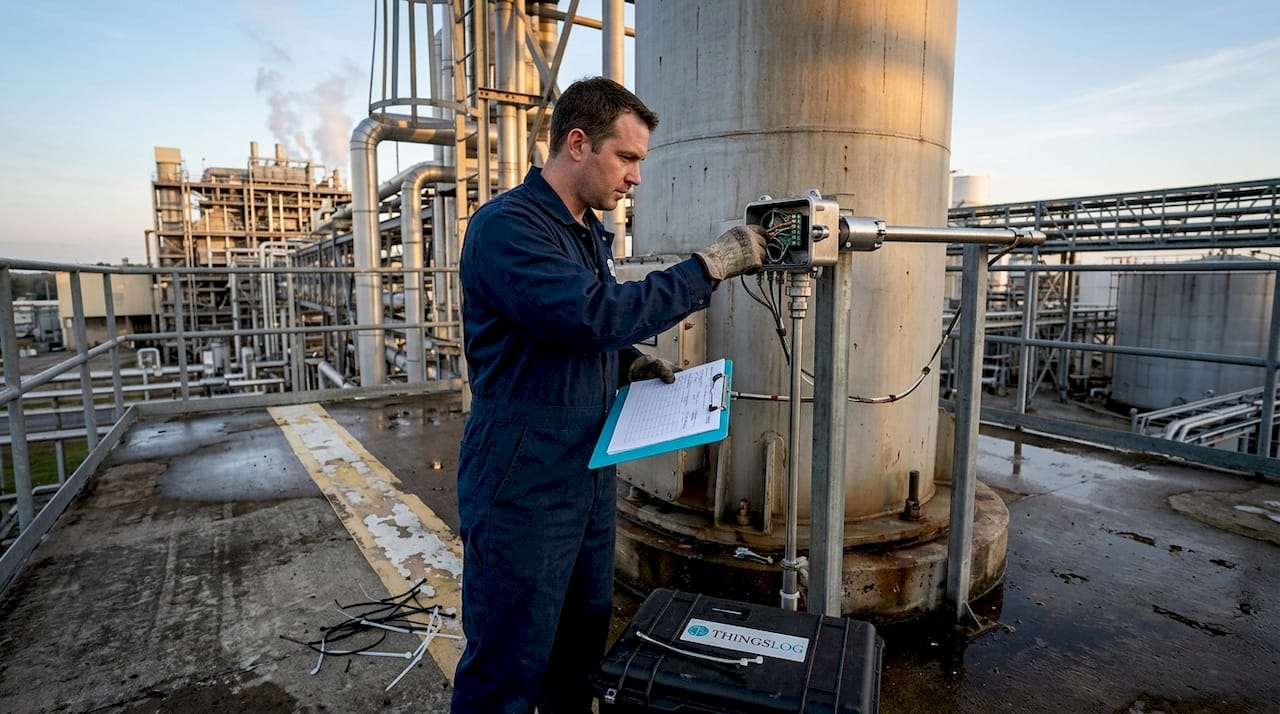
PEMS (Predictive Emissions Monitoring Systems) take a different approach. Rather than measuring emissions directly, PEMS use software-based predictive models that calculate expected emissions from process variables such as fuel flow rates, combustion temperatures, and load levels. PEMS are significantly cheaper to deploy and maintain, and they can be retrofitted to existing infrastructure without installing new hardware in the stack. The tradeoff is that regulatory acceptance varies by jurisdiction, and model accuracy depends entirely on the quality of process data feeding the algorithm.
| Feature | CEMS | PEMS |
|---|---|---|
| Measurement approach | Direct, hardware-based | Predictive, software-based |
| Regulatory acceptance | High, widely mandated | Varies by jurisdiction |
| Capital cost | High | Lower |
| Maintenance burden | High (calibration, hardware) | Lower (model updates, data quality) |
| Scalability | Moderate | High |
| Accuracy | Very high | High (data-dependent) |
| Best for | Regulated large emitters | Flexible, multi-site operations |
Both systems are increasingly enhanced with machine learning models that improve predictive accuracy over time. ML-enhanced PEMS, in particular, are showing strong performance in facilities where energy consumption monitoring is tightly integrated with emissions tracking. When process variables shift, the model adapts faster than a static algorithm.
“The integration of machine learning into emissions monitoring is shifting PEMS from a compliance workaround to a genuine operational intelligence tool. Facilities that treat PEMS as a data asset rather than just a regulatory substitute are seeing measurable gains in process efficiency.”
For air quality monitoring across facility perimeters or in ambient environments adjacent to your infrastructure, neither CEMS nor PEMS alone is sufficient. You need complementary sensor networks to fill the gaps.
Pro Tip: If your facility is considering PEMS for regulatory compliance, engage your relevant environmental authority early. Approval timelines and model validation requirements vary significantly by region and can affect your deployment schedule by six months or more.
Key operational considerations when choosing between CEMS and PEMS:
- Facilities subject to mandatory reporting under EPA or equivalent authorities typically cannot substitute PEMS for CEMS without formal approval
- PEMS can serve as a backup verification system even where CEMS is required, providing continuity during hardware downtime
- Newer ML-driven PEMS models reduce the performance gap with CEMS, particularly for natural gas combustion processes
Integrated sensor networks for air, water, and deposition monitoring
Beyond stack emissions, critical infrastructure organizations need a broader picture of their environmental footprint. This is where integrated sensor networks for air quality, water chemistry, and atmospheric deposition become operationally essential.
Long-term monitoring programs provide exactly this type of breadth. The EPA operates several programs for the power sector specifically: CASTNET monitors air quality trends and atmospheric deposition, the Long-Term Monitoring (LTM) program tracks surface water chemistry at lakes and streams affected by air pollution, and the National Atmospheric Deposition Program (NADP) captures wet deposition data across a national network of monitoring stations. These programs generate decades of baseline data that infrastructure managers can use to calibrate their own sensor deployments and understand long-term environmental trends in their operating regions.
| Program | Focus area | Data type | Coverage |
|---|---|---|---|
| CASTNET | Air quality, deposition | Dry deposition, ozone, acids | National, rural focus |
| LTM | Surface water chemistry | pH, ANC, sulfate, nitrate | Sensitive lake/stream sites |
| NADP | Wet deposition | Rain/snow chemistry | National grid network |
Deploying your own sensor network for air, water, or deposition monitoring requires attention to several critical factors:
- Sensor placement: Location relative to emission sources, prevailing wind direction, and hydrological pathways determines data quality. Poor placement produces misleading baselines.
- Protection against corrosion and water ingress: Sensors at bridges, coastal facilities, and water treatment plants face accelerated hardware degradation. Enclosure ratings (IP67 or above) and corrosion-resistant materials are non-negotiable for long-term stable operation.
- Power supply in remote locations: Many critical monitoring points lack grid power. Battery management for off-grid energy and multi-source energy harvesting (solar, wind, thermal) extend sensor life without manual intervention.
- Communication protocol selection: LoRa and NB-IoT are well suited for wide-area sensor networks with low data throughput needs, while LTE-M works better for higher-frequency data or firmware updates.
- Data integrity and redundancy: Network failures should not create regulatory data gaps. Edge storage with upstream synchronization protects against connectivity interruptions.
Pro Tip: When designing a sensor network for a large facility, map your monitoring points against your connectivity coverage before finalizing sensor selection. A LoRa gateway can cover up to 15 kilometers in open terrain, dramatically reducing the infrastructure cost compared to a wired or cellular-only network.
Real-world infrastructure deployments reveal important lessons. Industry case studies consistently show that organizations underestimate the maintenance burden of large sensor networks. Sensors that are not regularly checked for fouling, drift, or physical damage produce data that looks plausible but is systematically inaccurate. Building a maintenance schedule into your network design from day one is as important as the sensor hardware itself.
For water utilities specifically, water utility deployments demonstrate that integrating flow, pressure, pH, and turbidity sensors into a unified monitoring platform enables early leak detection, contamination alerts, and consumption optimization simultaneously. That level of integration is only possible when the hardware, connectivity, and analytics platform are designed to work together.
AI-enabled environmental monitoring for energy savings
Sensor networks generate enormous volumes of data. Without the right analytical layer, that data sits unused in a database while operational inefficiencies continue undetected. AI and machine learning change that equation by converting raw sensor outputs into actionable energy-saving decisions in near real time.
The performance benchmarks for AI-enabled monitoring are compelling. Facilities using AI-driven building management report 15 to 25 percent HVAC energy savings. Data centers applying AI to cooling and power distribution management achieve Power Usage Effectiveness (PUE) ratios between 1.1 and 1.3, compared to an industry average well above 1.5. Manufacturing operations using AI for process optimization see energy reductions of 5 to 12 percent. These are not aspirational figures — they are documented benchmarks from operational deployments.
How AI integrates with monitoring data in practice:
- Anomaly detection: AI models establish normal operating baselines and flag deviations instantly, whether that is a sudden spike in energy draw, a temperature excursion, or an unexpected change in water chemistry
- Predictive maintenance: By analyzing sensor degradation patterns, AI systems can schedule maintenance before failures occur, reducing both downtime and reactive repair costs
- Load optimization: In energy operations, AI balances load distribution across equipment to minimize peak demand charges and extend asset lifespan
- Automated reporting: Regulatory and ESG reporting that previously required manual data assembly can be generated automatically from continuous monitoring feeds
Siemens has demonstrated this approach in commercial building HVAC systems, where AI-optimized control reduced energy costs substantially without compromising occupant comfort. Target’s retail operations have applied similar principles across their store portfolio, achieving measurable energy reductions by integrating building sensor data with predictive analytics. For public sector organizations, the application extends to street lighting, municipal water systems, and public building energy management.
Key AI monitoring capabilities to look for in a platform:
- Real-time anomaly detection with configurable alert thresholds
- Historical trend analysis with correlation to operational variables
- Automated regulatory reporting and ESG data export
- Integration APIs for existing SCADA or ERP systems
- Mobile dashboards for field personnel and remote management teams
For residential building managers and large facility operators alike, the shift from reactive monitoring to predictive, AI-assisted management represents the most significant operational efficiency opportunity in the current market cycle.
Benchmark snapshot: Buildings with AI-enabled environmental monitoring report 15 to 25% HVAC savings. Data centers using AI cooling optimization achieve PUE as low as 1.1, compared to a global average above 1.5.
Why most environmental monitoring investments fall short
We have worked with organizations across water utilities, energy production, and public sector infrastructure, and the pattern is consistent: technology is rarely the primary reason monitoring investments underperform. The real culprits are integration gaps and insufficient operational buy-in.
Operations teams often inherit monitoring systems that were selected primarily for their technical specifications, not for how they fit into daily workflows. Sensors get installed, data starts flowing, and then nobody acts on it because the alerts are too frequent, the dashboards are not accessible to the people who make decisions, or the reporting requires manual interpretation. The monitoring system becomes a compliance checkbox rather than an operational tool.
Overspending on hardware without investing in data culture is a common and costly mistake. A sophisticated CEMS installation that feeds data into a system nobody reads adds regulatory certainty but zero operational value. The smart energy monitoring approach that consistently delivers results is one where monitoring outputs are directly tied to operational decisions at every level of the organization.
Sensor reliability over time is another underestimated risk. Sensors drift, foul, and degrade in ways that are not always visible in the data. Without a structured maintenance and calibration program, your “real-time” monitoring may be reporting conditions that no longer reflect reality. We recommend building sensor health monitoring into your platform from day one. Actionable reporting, organizational alignment, and reliable hardware are the three pillars that make any monitoring investment worthwhile.
Connect with scalable monitoring solutions
Selecting the right environmental monitoring type is only the first step. Turning that choice into sustained operational improvements requires a platform built for critical infrastructure from the ground up.
At ThingsLog, we design IIoT monitoring solutions that scale from single-site pilots to full-portfolio deployments, supporting LoRa, NB-IoT, LTE-M, Wi-Fi, and Ethernet connectivity. Our IIoT platform integrates configurable data loggers and environmental sensors with a robust cloud analytics layer and mobile app, giving your operations team real-time visibility from any location. The cloud and mobile monitoring platform supports automated alerting, trend analysis, and regulatory reporting in a single interface. For organizations with site-specific needs, our custom monitoring solutions deliver turnkey systems tailored to your exact operational and compliance requirements.
Frequently asked questions
What is the difference between CEMS and PEMS?
CEMS uses physical hardware for direct emissions sampling in flue gas streams, while PEMS uses software models built on process variables like fuel flow and temperature, making PEMS cheaper to scale in jurisdictions where regulators accept predictive approaches.
How can sensor networks improve operational decision-making?
Sensor networks provide continuous air, water, and deposition data that let infrastructure managers detect issues early. EPA programs like CASTNET and LTM show that long-term sensor data creates the operational benchmarks needed to separate normal variation from genuine performance problems.
What energy savings benchmarks exist for monitoring technology?
Facilities with AI-enabled monitoring report 15 to 25% HVAC savings, while data centers using AI-optimized cooling achieve PUE ratios as low as 1.1, compared to a global average above 1.5.
How do you protect sensors in harsh conditions?
Sensors deployed at bridges, coastal sites, or remote power infrastructure require corrosion-resistant enclosures rated IP67 or higher, and low-power multi-energy harvesting designs ensure continuous operation without grid dependency or frequent battery replacement.


