
TL;DR:
- Continuous, data-driven monitoring improves energy efficiency and occupant comfort in smart buildings.
- Combining fault detection and system optimization yields highest energy savings and operational benefits.
- Data quality, system interoperability, and security are critical for successful smart building monitoring.
Smart buildings are often reduced to automation talking points, but the real value lies in what happens after sensors go live. HVAC energy savings of over 25% are not theoretical projections—they are documented outcomes from facilities that committed to continuous, data-driven monitoring. For facility managers in energy, water utilities, and hospitality, the gap between a building that performs and one that drains budget comes down to how well you capture, interpret, and act on operational data. This guide walks through what smart building monitoring actually involves, which methodologies deliver results, what the numbers look like, and where most implementations go wrong.
Table of Contents
- What is smart building monitoring?
- Key methodologies and technologies in smart monitoring
- Business impact: ROI, energy savings, and sustainability
- Common challenges and how to avoid them
- The expert’s take: What most people miss about smart building monitoring
- How to get started with smart building monitoring
- Frequently asked questions
Key Takeaways
| Point | Details |
|---|---|
| Tangible ROI | Smart building monitoring typically delivers 25-28% energy savings and payback in under a year. |
| Data quality is critical | Effective solutions address sensor accuracy, system interoperability, and security from the start. |
| Advanced tech drives results | Modern monitoring uses AI, AFDD, and ASO for predictive maintenance and optimized controls. |
| Comprehensive strategies win | Combining passive upgrades with active monitoring unlocks superior performance and sustainability. |
What is smart building monitoring?
Smart building monitoring is the practice of using connected sensors and software systems to continuously track a facility’s physical and operational conditions. It goes well beyond reading a meter once a month. At its core, it integrates IoT sensors, BMS, and EMIS to deliver real-time data on energy use, HVAC performance, occupancy, CO2 levels, temperature, and humidity—all feeding into a centralized platform where patterns become visible and problems surface early.
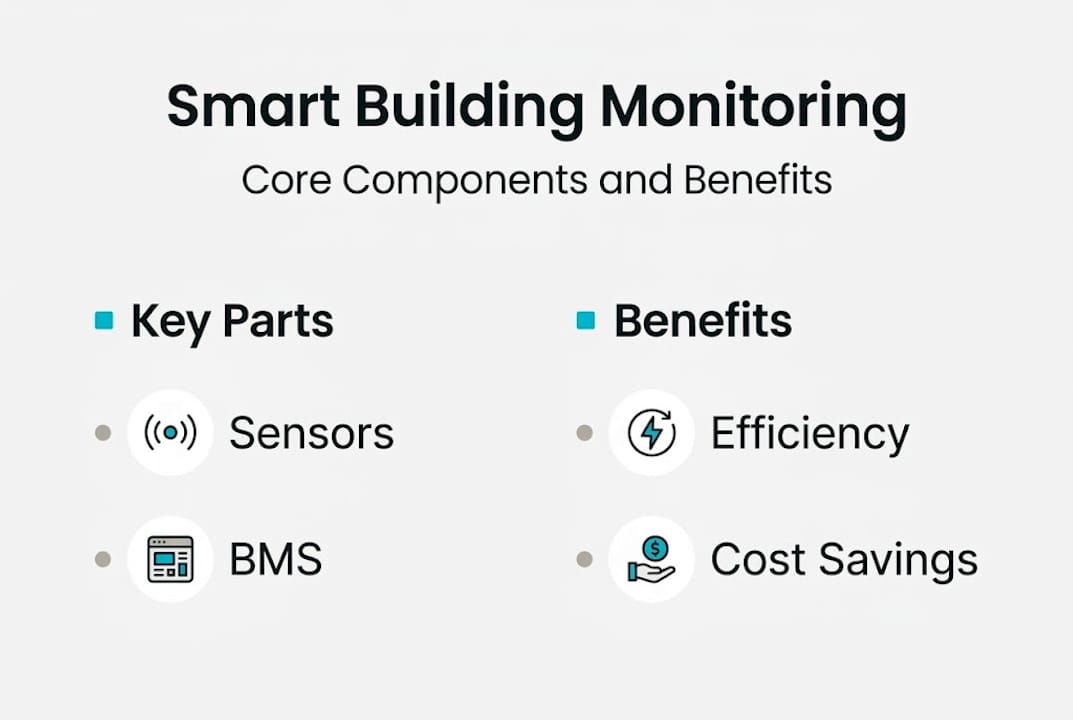
The key components work in sequence. Sensors collect raw physical data. A Building Management System (BMS) aggregates that data and controls mechanical systems. An Energy Management Information System (EMIS) layers analytics on top, turning raw readings into actionable insights. Protocols like BACnet and Modbus allow these systems to communicate across different manufacturers and generations of equipment, which matters enormously in older facilities with mixed infrastructure.
Here is how smart monitoring compares to traditional approaches:
| Feature | Traditional monitoring | Smart building monitoring |
|---|---|---|
| Data collection | Manual or scheduled | Continuous, automated |
| Fault detection | Reactive, after failure | Proactive, pattern-based |
| Energy visibility | Monthly billing | Real-time, granular |
| Occupancy response | Fixed schedules | Dynamic, sensor-driven |
| Reporting | Manual spreadsheets | Automated dashboards |
For IoT energy management, the practical benefits are immediate. Facilities detect equipment faults before they escalate, maintain occupant comfort more consistently, and reduce energy waste by matching system output to actual demand. In hospitality, this means guest rooms are conditioned only when occupied. In utilities, it means pump stations run on optimized schedules rather than fixed timers.
Key advantages for targeted industries include:
- Faster fault detection: Issues are flagged in minutes, not days
- Improved occupant comfort: Systems respond to real conditions, not assumptions
- Lower operational costs: Demand-matched controls reduce unnecessary runtime
- Audit-ready data: Continuous logs support compliance and ESG reporting
- Scalability: Start with one building, expand across a portfolio without replacing infrastructure
Key methodologies and technologies in smart monitoring
Knowing the components is useful. Understanding how they work together is what separates a functioning deployment from a genuinely high-performing one. Two methodologies stand out as the most impactful in real-world facility management.
Automated Fault Detection and Diagnosis (AFDD) continuously scans sensor data for patterns that indicate equipment problems. It does not wait for a system to fail—it recognizes the early signatures of a failing valve, a miscalibrated sensor, or an HVAC unit running outside its efficiency curve. Automated System Optimization (ASO) goes further by actively adjusting controls based on occupancy data, weather forecasts, and load predictions, rather than relying on static schedules.
The technology stack that supports these methodologies follows a clear hierarchy:
- Sensors and meters capture physical data at the point of interest
- Edge devices process data locally, reducing latency and cloud dependency
- BMS/EMS platforms aggregate and control building systems
- AFDD and ASO engines apply analytics and optimization logic
- Dashboards and alerts surface insights for facility teams
Supporting this stack, rule-based, model-based, and AI-driven diagnostics including neural networks and support vector machines now power advanced building analytics. Model Predictive Control (MPC) is particularly effective, using forecasted conditions to pre-condition spaces efficiently rather than reacting after the fact.
The empirical outcomes are well-documented:
| Methodology | Typical energy savings | Comfort improvement |
|---|---|---|
| AFDD only | 10-15% | Moderate |
| ASO only | 15-20% | Significant |
| AFDD + ASO combined | Up to 28% | 74% fewer complaints |
Pro Tip: Deploy edge AI processing where possible. It reduces real-time energy monitoring costs by cutting the volume of raw data sent to the cloud, and it keeps sensitive operational data closer to the source. This is especially relevant for water utilities and energy infrastructure where network reliability is not always guaranteed.
For teams focused on saving on energy bills, the combination of AFDD and ASO is the most reliable path. Neither methodology alone achieves the same result as running both in parallel, with each informing the other.
Business impact: ROI, energy savings, and sustainability
The technology case is strong. The business case is stronger. Real deployments consistently show that smart building monitoring pays for itself faster than most capital investments in facility infrastructure.
“A 15-building office portfolio achieved 25% HVAC cost reduction, saving $94,000 annually with a payback period under nine months. A single large office tower delivered 28% savings worth $392,000 per year.”
Those are not outliers. The 7 to 9 month payback period appears repeatedly across case studies in commercial real estate, hospitality, and utilities. The driver in each case is the same: replacing fixed, schedule-based controls with dynamic, sensor-driven ones eliminates the largest source of energy waste in most buildings.
Beyond direct cost reduction, the non-financial benefits compound over time:
- 74% reduction in occupant comfort complaints when AFDD and ASO run together
- Demand response participation: Real-time monitoring enables facilities to shed load during grid stress events, generating revenue or avoiding peak tariffs
- ESG compliance: Continuous data logs provide the granular evidence required for sustainability certifications and corporate reporting
- Predictive maintenance: Early fault detection extends equipment life, reducing capital replacement cycles
For energy consumption optimization in retail and hospitality, the gains extend to guest experience and brand reputation. A hotel that maintains consistent room temperatures and air quality without manual intervention scores higher on guest satisfaction metrics. A retail chain that reduces energy intensity per square meter strengthens its sustainability narrative with both regulators and consumers.

The key insight for decision-makers is that energy consumption monitoring is not a one-time project. It enables ongoing improvement. Each month of operational data refines the models, tightens the optimization, and surfaces new opportunities. The savings in year two often exceed those in year one.
Common challenges and how to avoid them
No technology delivers results automatically. Smart building monitoring projects fail—or underperform—for predictable reasons. Knowing them in advance is the most effective form of risk management.
-
Data quality gaps: Sensor noise, missing values, and calibration drift are the most common root cause of poor AI performance. Remarkably, 69% of projects overlook data quality as a formal concern. If your input data is unreliable, every downstream analysis is compromised.
-
Interoperability failures: Facilities with mixed-vintage equipment often have protocol mismatches between BACnet, Modbus, and proprietary systems. Frameworks like Project Haystack and Brick Schema provide standardized data models that reduce integration friction significantly.
-
Cybersecurity exposure: IoT devices connected to operational networks create attack surfaces. Unsecured endpoints and flat network architectures are common vulnerabilities. Network segmentation, device authentication, and encrypted communications are baseline requirements, not optional additions.
-
Governance gaps: Without defined ownership of data quality, alert response, and system updates, monitoring platforms degrade over time. Assign clear roles before deployment.
For teams evaluating LoRaWAN IoT monitoring for large or distributed facilities, connectivity reliability adds another layer of complexity. Choosing the right protocol for your environment—whether LoRa, NB-IoT, or LTE-M—affects both data quality and system resilience.
Pro Tip: Before selecting any IoT monitoring solutions, audit your existing sensor infrastructure for calibration status and communication protocol compatibility. A two-week data quality baseline assessment prevents months of troubleshooting after deployment.
Avoiding predictive maintenance pitfalls requires treating data governance as a first-class concern from day one, not an afterthought once problems emerge.
The expert’s take: What most people miss about smart building monitoring
We see a consistent pattern in how organizations approach smart building monitoring. They invest heavily in sensors and connectivity, then underinvest in the EMIS layer and data governance that actually drive lasting performance gains. The hardware is visible and tangible. The analytics infrastructure is not. But it is where the real value accumulates.
Another overlooked opportunity is the combination of passive envelope upgrades with active, AI-driven controls. Insulation, glazing, and shading reduce the load that monitoring systems then optimize. Treating them as separate workstreams leaves significant savings on the table.
Edge computation deserves more attention than it typically receives. EMIS analytics and edge processing can reduce cloud traffic substantially while improving response times and data security. For utilities and energy infrastructure, where operational continuity is non-negotiable, edge-first architectures are not just efficient—they are strategically sound. Explore energy optimization strategies that combine these layers for the strongest long-term outcomes.
How to get started with smart building monitoring
For facility leaders ready to make a practical leap, the right tools and partners can simplify adoption considerably.
At ThingsLog, we build IIoT solutions specifically for the infrastructure sectors where monitoring precision matters most. Our platform connects configurable data loggers and environment sensors to a cloud analytics layer, giving you real-time visibility across energy, HVAC, water, and air quality in a single interface. Understanding how ThingsLog IIoT works takes minutes, and our ThingsLog cloud platform is designed to scale from a single pilot site to a full portfolio. If you are evaluating options for remote IoT monitoring, we are ready to help you define the right starting point for your facility.
Frequently asked questions
What types of data are most important to monitor in smart buildings?
Smart building monitoring prioritizes energy use, HVAC performance, indoor air quality, CO2 levels, temperature, humidity, and occupancy data. These metrics together enable actionable insights and dynamic system optimization.
How quickly can facility managers expect ROI from smart building monitoring?
Empirical benchmarks consistently show a 7 to 9 month payback period, with annual HVAC cost reductions ranging from 25% to 28% depending on building type and baseline efficiency.
What are the most common data pitfalls in smart building monitoring?
Sensor noise, missing values, and poor interoperability between systems are the leading issues. 69% of projects fail to implement formal data quality controls, which undermines the performance of any analytics layer built on top.
How can smart monitoring support sustainability goals?
By enabling demand response participation, optimizing energy consumption in real time, and generating the granular data logs required for ESG reporting, smart monitoring creates a measurable sustainability impact that compounds year over year.


